Google Play Store Statistical Analysis in Python

A project that uses Python to explore various statistics of a dataset regarding Google Play Store app reviews.
The code below displays highlights from the project. For more details, please view the GitHub Repository.
Link to GitHub Repository:
Libraries and Data
import thinkstats2
import csv
import pandas
import thinkplot
df = pandas.read_csv('googleplaystore_2.csv')
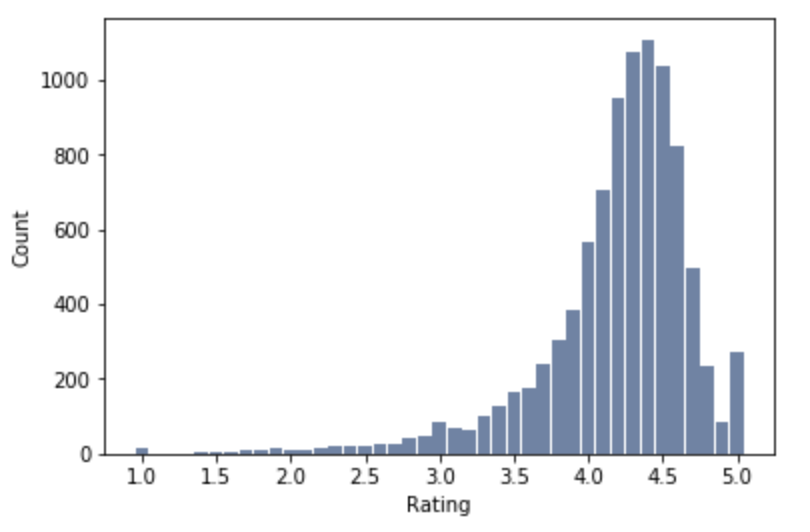
Histogram of the Ratings Variable
hist_rating = thinkstats2.Hist(df.Rating)
thinkplot.Hist(hist_rating)
thinkplot.Show (xlabel = "Rating", ylabel = "Count")
Calculate the mean, mode, median, variance, and standard deviation of the Ratings Variable
mean_rating = df.Rating.mean()
mode_rating = df.Rating.mode()
median_rating = df.Rating.median()
var_rating = df.Rating.var()
std_rating = df.Rating.std()
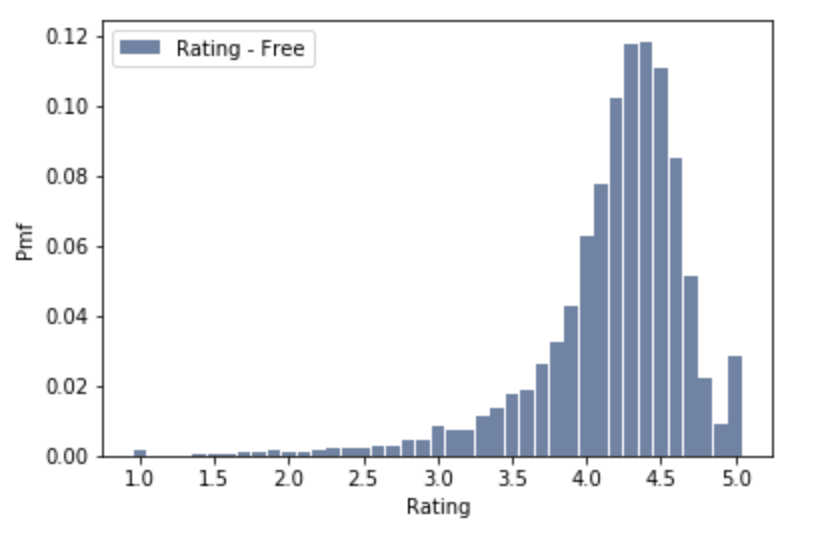
Plot the PMF of the Ratings of Free Apps
pmf_free = thinkstats2.Pmf(free_apps.Rating, label='Rating - Free')
thinkplot.Hist(pmf_free)
thinkplot.Config(xlabel='Rating', ylabel='Pmf')
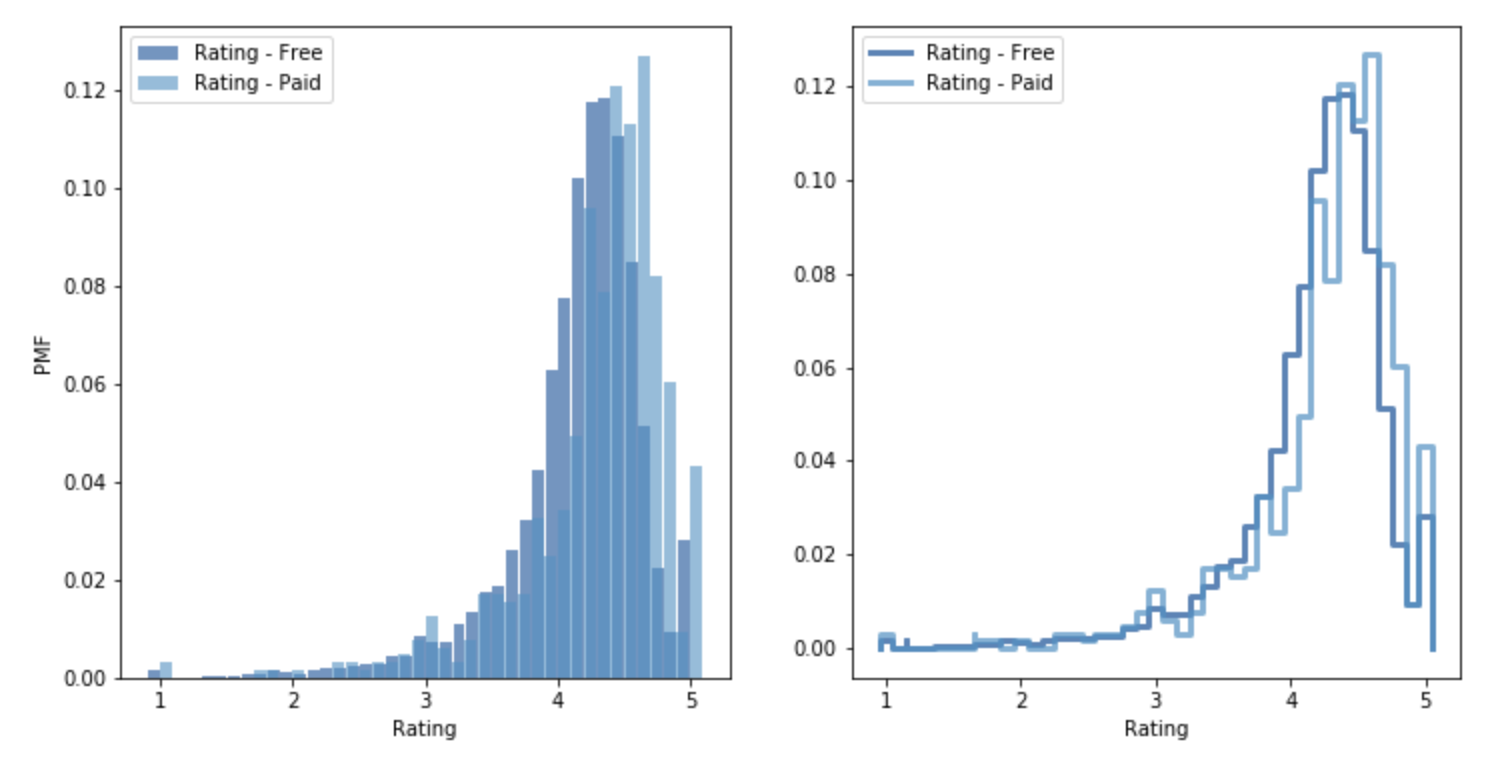
Two histograms comparing the PMF of the Ratings of Paid vs. Free apps
# Create PMF variable of the Ratings of Paid Apps
pmf_paid = thinkstats2.Pmf(paid_apps.Rating, label='Rating - Paid')
thinkplot.PrePlot(2, cols=2)
thinkplot.Hist(pmf_free, align='right')
thinkplot.Hist(pmf_paid, align='left')
thinkplot.Config(xlabel='Rating', ylabel='PMF')

thinkplot.PrePlot(2)
thinkplot.SubPlot(2)
thinkplot.Pmfs([pmf_free, pmf_paid])
thinkplot.Config(xlabel='Rating')
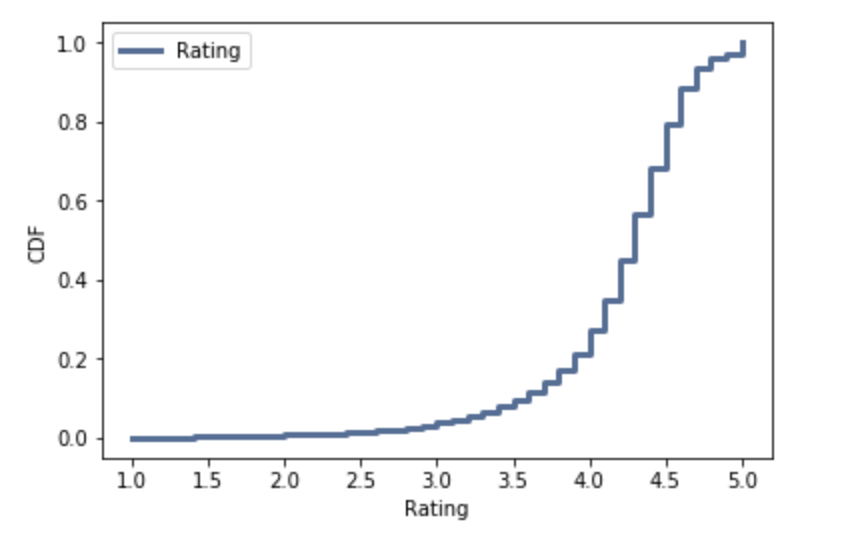
CDF of Ratings
# Create CDF variable for Ratings
cdf_rating = thinkstats2.Cdf(df.Rating, label = 'Rating')
# Plot the CDF for Ratings variable
thinkplot.Cdf(cdf_rating)
thinkplot.Show(xlabel = 'Rating', ylabel = 'CDF')