Sentiment Analysis on NYT Finance Headlines in Python

A project that uses machine learning to perform sentiment analysis on New York Times Finance headlines.
The code below displays highlights from the project. For more details, please view the GitHub Repository.
Link to GitHub Repository:
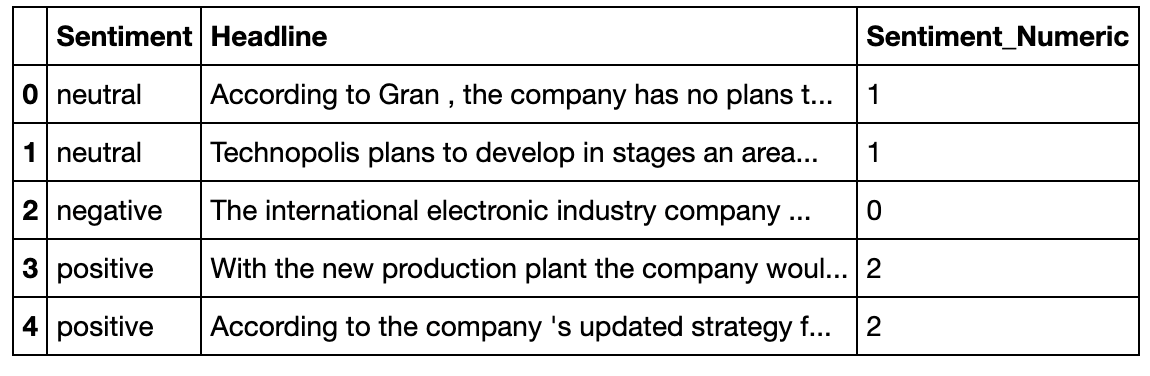
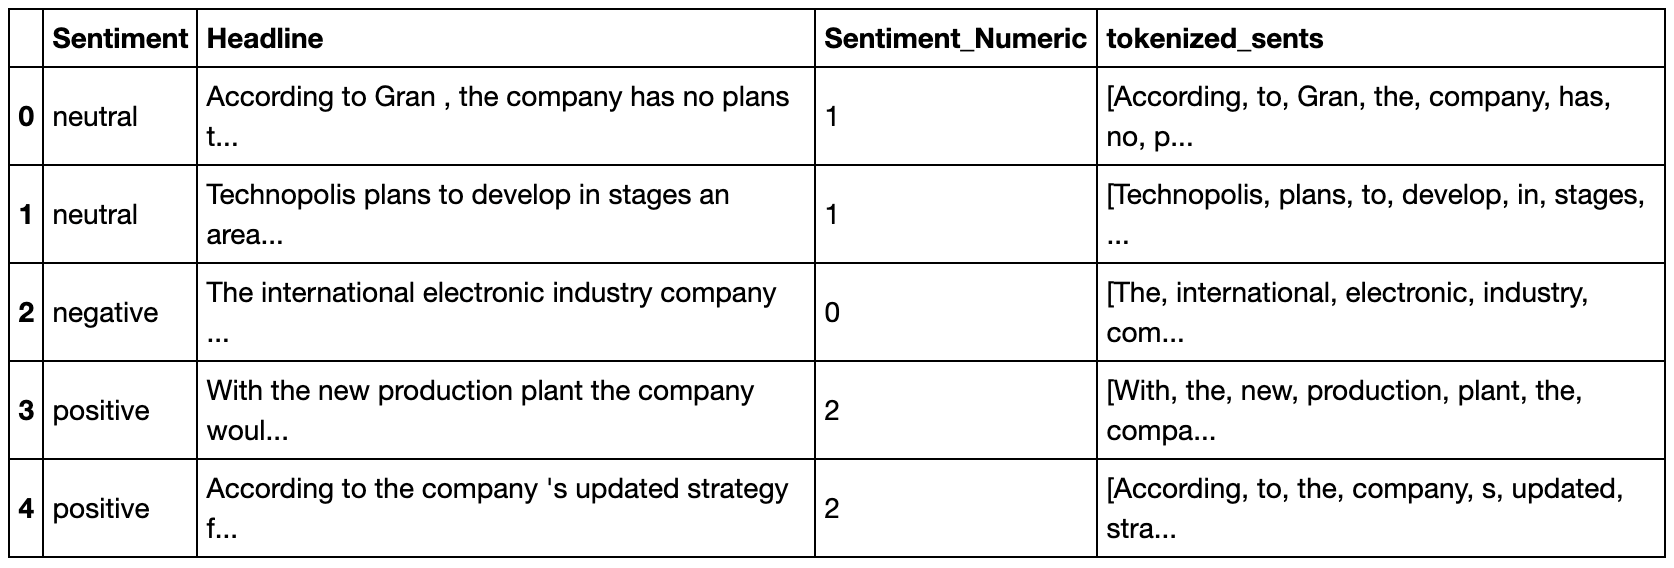
Convert sentiments to numeric values to prepare for machine learning algorithms.
data['Sentiment_Numeric'] = data['Sentiment']
data.loc[data.Sentiment == 'negative', 'Sentiment_Numeric'] = 0
data.loc[data.Sentiment == 'neutral', 'Sentiment_Numeric'] = 1
data.loc[data.Sentiment == 'positive', 'Sentiment_Numeric'] = 2
data.head()
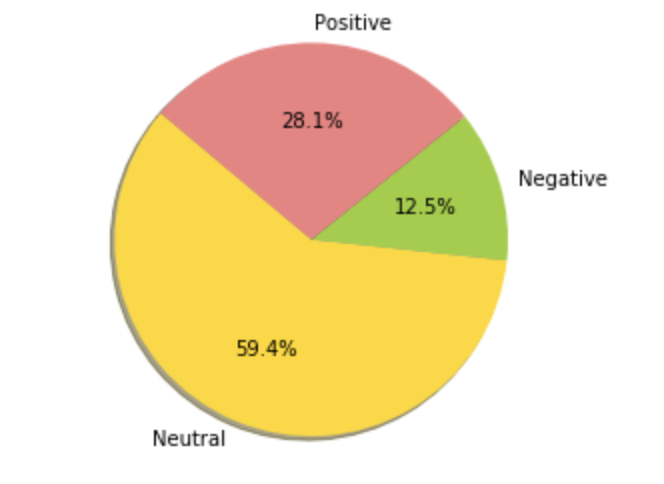
Pie chart of distribution of sentiment labels
labels = 'Neutral', 'Negative', 'Positive'
sizes = [2879,604,1363]
colors = ['gold', 'yellowgreen', 'lightcoral']

# Plot
plt.pie(sizes, labels=labels, colors=colors,
autopct='%1.1f%%', shadow=True, startangle=140)

plt.axis('equal')
plt.show()
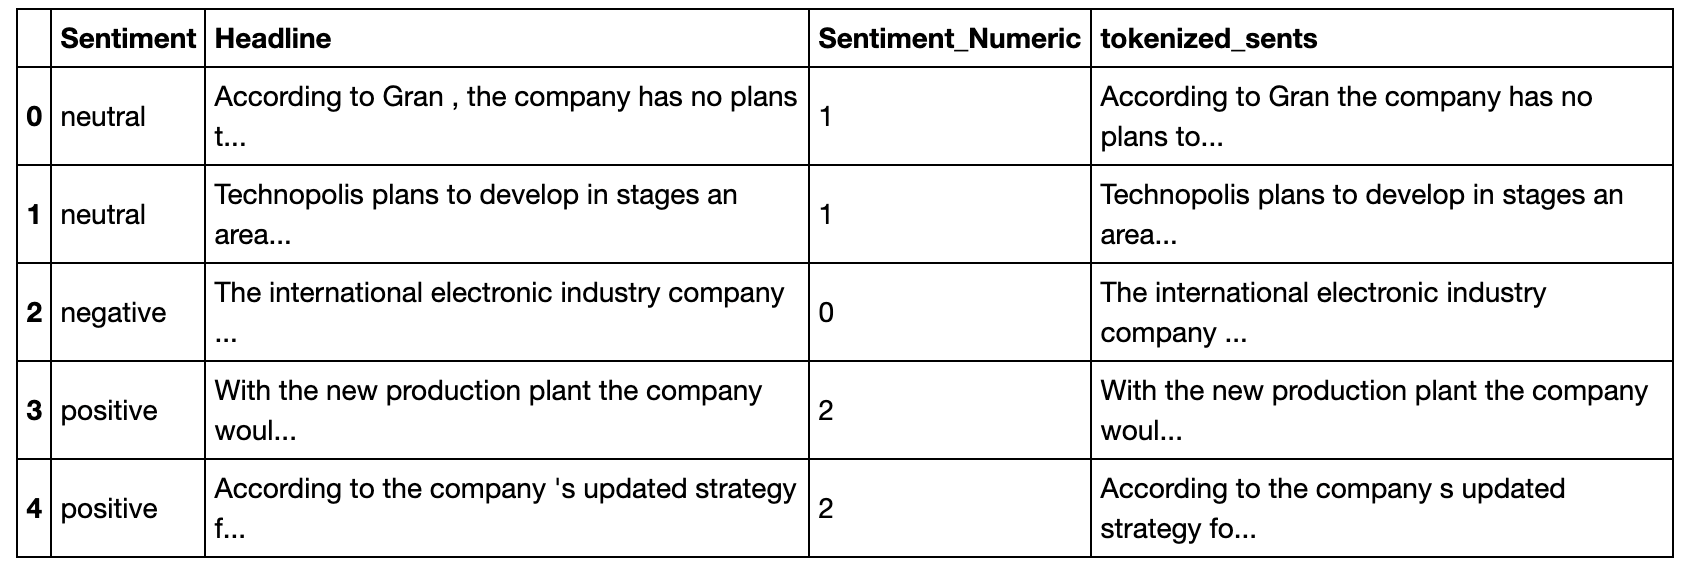
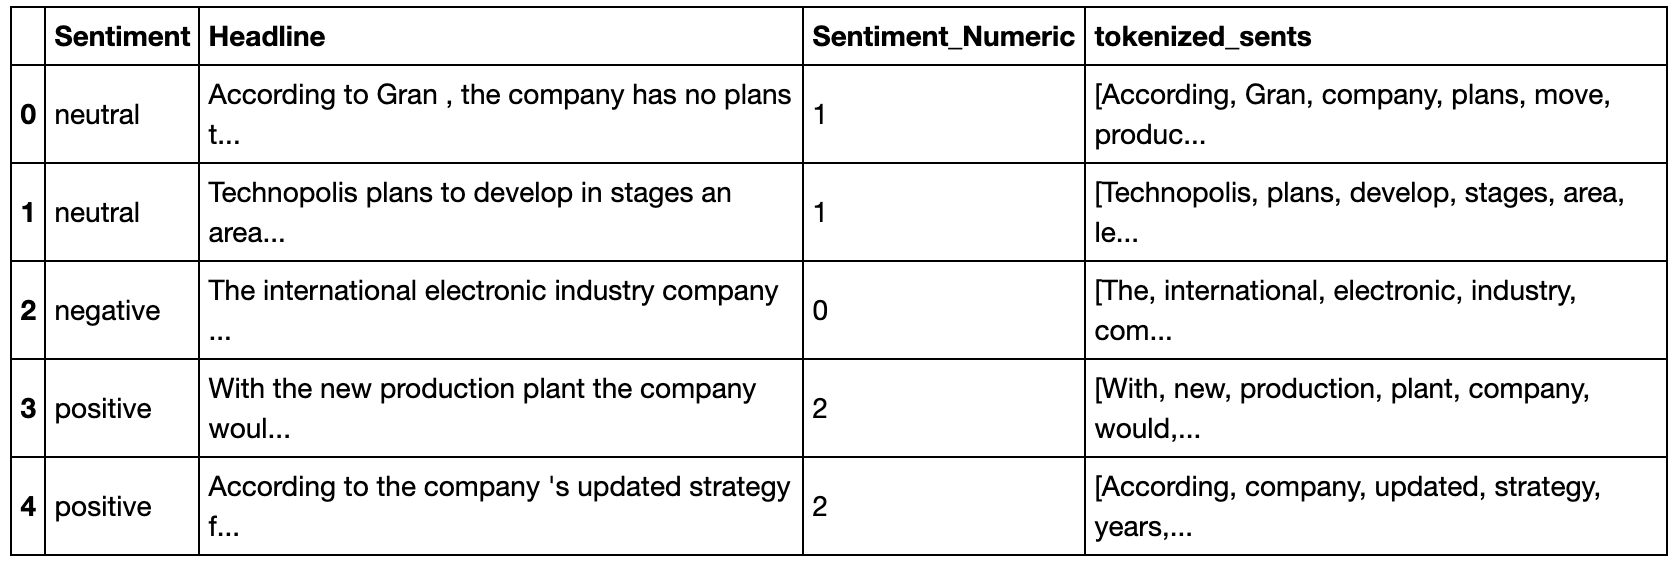
Remove punctuation
data['tokenized_sents'] = data['Headline'].str.replace('[{}]'.format(string.punctuation), '')
data.head()
Create WordCloud
top_N = 2000
txt = data.tokenized_sents.str.lower().str.replace(r'\|', ' ').str.cat(sep=' ')
words = nltk.tokenize.word_tokenize(txt)
word_dist = nltk.FreqDist(words)
stopwords_2 = nltk.corpus.stopwords.words('english')
words_except_stop_dist = nltk.FreqDist(w for w in words if w not in stopwords_2)

rslt = pd.DataFrame(word_dist.most_common(top_N),
                    columns=['Word', 'Frequency'])

rslt = pd.DataFrame(words_except_stop_dist.most_common(top_N),
                    columns=['Word', 'Frequency']).set_index('Word')

rslt.to_csv('namesDFtoCSV')
reader = csv.reader(open('namesDFtoCSV', 'r',newline='\n'))
next(reader)
d = {}
for k,v in reader:
    d[k] = int(v)
wordcloud = WordCloud()
wordcloud.generate_from_frequencies(d)
plt.imshow(wordcloud)
plt.axis("off")
plt.show()

Tokenize Sentences
data['tokenized_sents'] = data.apply(lambda row: nltk.word_tokenize(row['tokenized_sents']), axis=1)
data.head()
Remove Stopwords
stop_words = set(stopwords.words('english'))
#stop_words.update(punctuation)
data['tokenized_sents'] = data['tokenized_sents'].apply(lambda row: [item for item in row if item not in stop_words])
data.head()
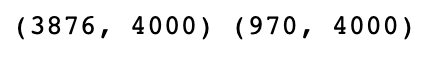
Create Training and Testing datasets and then apply TF-IDF Vectorizer
X_train,X_test,y_train,y_test = train_test_split(data['tokenized_sents'],data['Sentiment_Numeric'],test_size = 0.2 , random_state = 0)
y_train = y_train.astype('int')
y_test = y_test.astype('int')

# TF-IDF Vectorizer
vectorizer = TfidfVectorizer(tokenizer=lambda doc: doc, lowercase=False, ngram_range=(1,2),
                             max_df=0.9, min_df=0, max_features=4000)
train_vectors = vectorizer.fit_transform(X_train)
test_vectors = vectorizer.transform(X_test)
print(train_vectors.shape, test_vectors.shape)
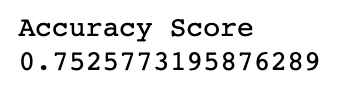
Build Logistic Regression Model
# Train Logistic Regression model
LR_model = LogisticRegression(C=10).fit(train_vectors, y_train)
# Test Logistic Regression model
predicted = LR_model.predict(test_vectors)
print("Accuracy Score")
print(accuracy_score(y_test,predicted))
Perform Text Processing steps on New York Times Headline Data
# Import NYT Data
Jan2020_NYT_data = pd.read_csv('NYT_headline_data_012020.csv')
# Remove Punctuation
Jan2020_NYT_data['headline'] = Jan2020_NYT_data['0'].str.replace('[{}]'.format(string.punctuation), '')
# Tokenize Sentences
Jan2020_NYT_data['headline'] = Jan2020_NYT_data.apply(lambda row: nltk.word_tokenize(row['headline']), axis=1)
# Remove StopWords
stop_words = set(stopwords.words('english'))
Jan2020_NYT_data['headline'] = Jan2020_NYT_data['headline'].apply(lambda row: [item for item in row if item not in stop_words])
# TF-IDF Vectorizer
X_NYT_Jan2020 = Jan2020_NYT_data['headline'].values
Jan2020_NYT_vectors = vectorizer.transform(X_NYT_Jan2020)
Run model on New York Times Data
# Run Naive Bayes Model on NYT Headlines
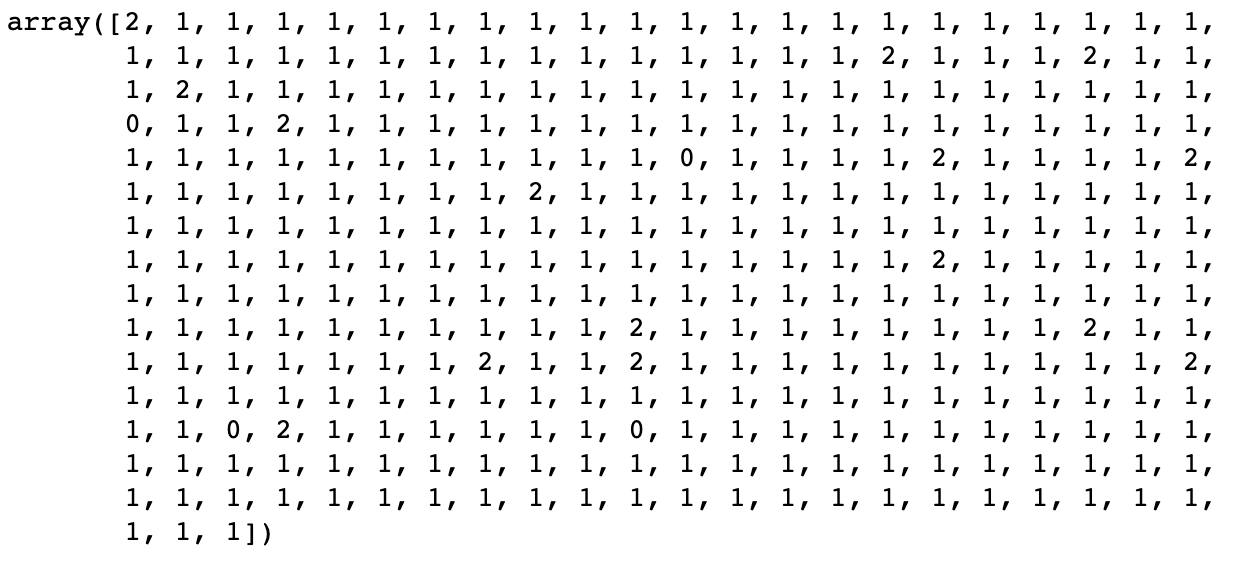
Jan2020_NYT_predicted = LR_model.predict(Jan2020_NYT_vectors)
Jan2020_NYT_predicted
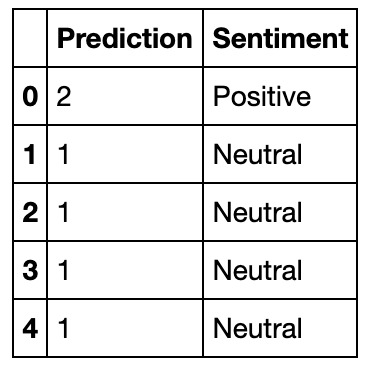
Import results to DataFrame and convert numeric values to sentiments
Jan2020Sentiment = pd.DataFrame({'Prediction': Jan2020_NYT_predicted})

# Function to convert numbers to sentiment label
def label_sentiment (row):
    if row['Prediction'] == 0 :
      return 'Negative'
    if row['Prediction'] == 1 :
      return 'Neutral'
    if row['Prediction'] == 2 :
      return 'Positive'
    return 'Other'

Jan2020Sentiment['Sentiment'] = Jan2020Sentiment.apply (lambda row: label_sentiment(row), axis=1)
Jan2020Sentiment.head()
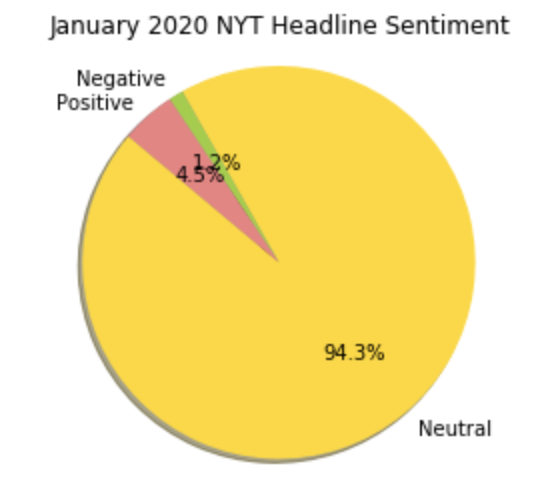
Create Pie Chart of distribution of sentiments
Jan2020_sentiment_counts = Jan2020Sentiment['Sentiment'].value_counts()
labels = 'Neutral', 'Negative', 'Positive'
sizes = [314,4,15]
colors = ['gold', 'yellowgreen', 'lightcoral']

# Plot
plt.pie(sizes, labels=labels, colors=colors,
autopct='%1.1f%%', shadow=True, startangle=140)

plt.axis('equal')
plt.title('January 2020 NYT Headline Sentiment')
plt.show()