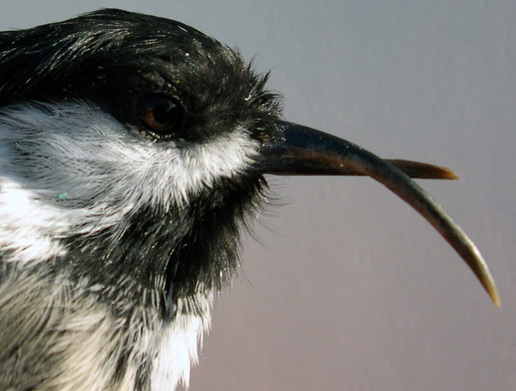
Alaskan Crow Data Exploration and Machine Learning in R
This project uses R to explore and prepare data for machine learning algorithms. The subject of the data includes information on Alaskan crows. The majority of the subjects showed evidence of AKD (Avian Keratin Disorder) which means the beak of the bird shows deformities. Blood samples were taken from each subject and tested for three different pathogens. The project seeks to explore what data science strategies can be applied to these data to find patterns and trends in detecting either of the three blood pathogens and the presence of AKD.
The code below displays highlights from the project. For more details, please view the GitHub Repository.
Link to GitHub Repository:
Import libraries
library(ggplot2)
library(ggmap)
library(maps)
library(mapdata)
library(usmap)
library(rpart)
library(rpart.plot)
library(caTools)
library(ROCR)
library(naivebayes)
library(dplyr)
One-Hot Encoding of location data
for(unique_value in unique(de$LOC)){

de[paste("LOC", unique_value, sep = ".")] <- ifelse(de$LOC == unique_value, 1, 0)
}
Filter out N/A values and organize columnns
de <- de[,c(7,8,9,10,11,12,14,16,18,23,24,25,26,27,28)]
de<-de[complete.cases(de),]
Code for Logistic Regression on AKD
mylogit <- glm(AKD ~ SEX + AGE + TARSUS + WING + MASS + LEUC1 + HAEM1 + PLAS1 + LOC.SEWA + LOC.KENA + LOC.VALD + LOC.HAIN + LOC.JUNE + LOC.HOME, data = de, family = "binomial")
confint.default(mylogit)
set.seed(88)
split <- sample.split(de$AKD, SplitRatio = 0.75)
dresstrain <- subset(de, split == TRUE)
dresstest <- subset(de, split == FALSE)
model <- glm (AKD ~ SEX + AGE + TARSUS + WING + MASS + LEUC1 + HAEM1 + PLAS1 + LOC.SEWA + LOC.KENA + LOC.VALD + LOC.HAIN + LOC.JUNE + LOC.HOME, data = dresstrain, family = "binomial")
summary(model)
predict <- predict(model, type = 'response')
tab2 <- table(dresstrain$AKD, predict > 0.5)
# Misclassification
incorrect <- 1 - sum(diag(tab2)) / sum(tab2)
correct<- 100*(1 - incorrect)
#ROCR Curve
ROCRpred <- prediction(predict, dresstrain$AKD)
ROCRperf <- performance(ROCRpred, 'tpr','fpr')
plot(ROCRperf, colorize = TRUE, text.adj = c(-0.2,1.7))
#plot glm
ggplot(dresstrain, aes(x=AGE, y=AKD)) + geom_point() +
stat_smooth(method="glm", family="binomial", se=FALSE)
Factoring of Data
de$SEX <- as.factor(de$SEX)
de$AGE <- as.factor(de$AGE)
de$AKD <- as.factor(de$AKD)
de$TARSUS <- as.factor(de$TARSUS)
de$WING <- as.factor(de$WING)
de$MASS <- as.factor(de$MASS)
de$LEUC1 <- as.factor(de$LEUC1)
de$HAEM1 <- as.factor(de$HAEM1)
de$PLAS1 <- as.factor(de$PLAS1)
de$LOC.SEWA <- as.factor(de$LOC.SEWA)
de$LOC.KENA <- as.factor(de$LOC.KENA)
de$LOC.VALD <- as.factor(de$LOC.VALD)
de$LOC.HAIN <- as.factor(de$LOC.HAIN)
de$LOC.JUNE <- as.factor(de$LOC.JUNE)
de$LOC.HAIN <- as.factor(de$LOC.HAIN)
AKD Decision Tree
names(de) <- c("Sex","Age","AKD","Tarsus","Wing","Mass","LEUC1","HAEM1","PLAS1","SEWA","KENA","VALD","HAIN","JUNE","HOME")
ran <- sample(1:nrow(de), 0.9 * nrow(de))
data_train <- de[ran,]
data_test <- de[-ran,]
dtm <- rpart(AKD~., data_train, method="class")
rpart.plot(dtm, compress=TRUE, uniform=TRUE)
p <- predict(dtm, data_test, type="class")
confMat <- table(data_test$AKD,p)
accuracy <- sum(diag(confMat))/sum(confMat)
return (accuracy*100)
AKD Naive Bayes Model
set.seed(1234)
ind <- sample(2, nrow(de), replace = T, prob = c(0.8,0.2))
train <- de[ind == 1,]
test <- de[ind == 2,]
# Model
model <- naive_bayes(AKD ~ ., data = train, laplace=1)
# Predict
p <- predict(model, train, type = 'prob')
# Train
p1 <- predict(model, train)
tab1 <- table(p1, train$AKD)
# Misclassification
incorrect <- 1 - sum(diag(tab1)) / sum(tab1)
correct<- 100*(1 - incorrect)
# Test
p2 <- predict(model, test)
tab2 <- table(p2, test$AKD)
# Misclassification
incorrect <- 1 - sum(diag(tab2)) / sum(tab2)
correct<- 100*(1 - incorrect)
Map Creation
Prepare data for maps
de_2 <- de[,c(1,2,4)]
LEUC1_Count <- de %>% group_by(LOC)  %>% count(LEUC1) %>% filter(LEUC1==1)
LEUC1_Count_2 <- merge(LEUC1_Count, de_2, by.x='LOC', by.y='LOC', all=TRUE)
LEUC1_Count_2 <- LEUC1_Count_2[,c(4,5,1,3)]
Plot LEUC1 variable on Map
LEUC1_Count_2 <- data.frame(LEUC1_Count_2)
transformed_data_LEUC1 <- usmap_transform(LEUC1_Count_2)
plot_usmap("states", include=c("AK")) +
  geom_point(data = transformed_data_LEUC1,
             aes(x = LONG.1, y = LAT.1, group=LOC, size=n),
             color = "red") +
  ggtitle("LEUC1 per Location")
